Getting Started
Welcome to the Chicago Community Dashboard, a resource for those interested in the elements that shape quality of life across the city.
Selecting a community
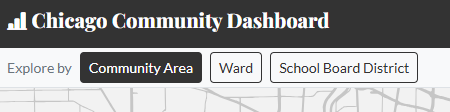
To begin, select the type of community you'd like to explore, the options are on the top left of the home page:
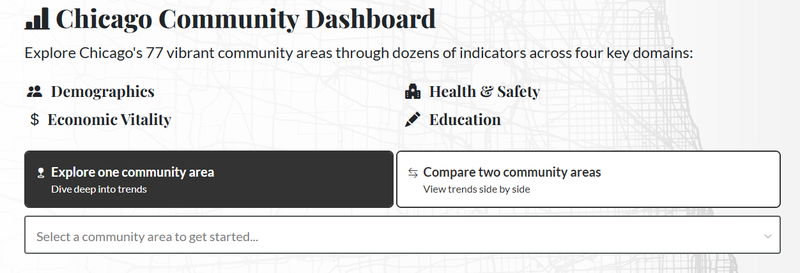
You can select one community, or click the 'Compare two communities' button to see two communities side-by-side.
Each community’s dashboard page begins with an interactive map and a summary of the population by age, race/ethnicity, and income, followed by a menu of domains:
- Key Trends
- Charts that show the indicators that have changed the most within the community over the years, and the indicators that have changed for the community the most relative to the whole city of Chicago.
- Demographics
- Health & Safety
- Economic Vitality
- Education
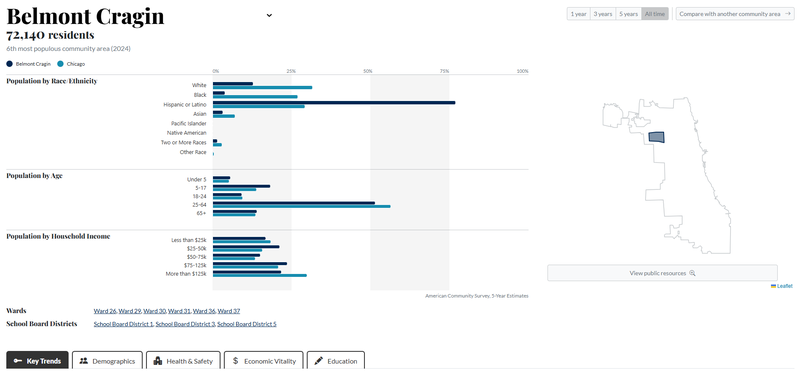
The timescale selector at the top right of the page allows you to choose how many years of data to see—the default selection is ‘all time,’ which is usually about 10 years.
Interactive charts
Click a domain heading to reveal charts for each domain's indicators. These top-level charts display the general trend for whatever timescale has been selected.
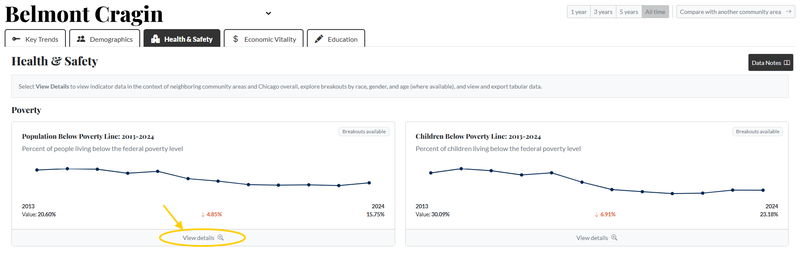
For each indicator within a domain, click the ‘View Details’ button to open an interactive chart and customize your view.
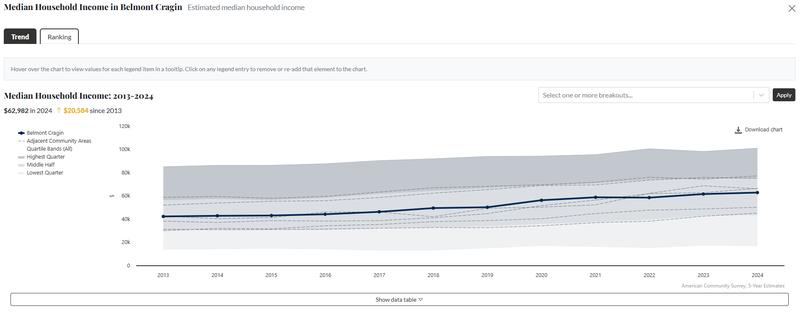
Tips for navigating a detailed chart:
- Click any item in the chart legend to remove it from the chart; click it again to add it back.
- In some indicators, you can view trends by demographic subgroups (age, sex, or race/ethnicity). Use the demographic disaggregation menu in the top right corner of the chart to select one or more subgroups.
- Once you’ve adjusted a chart to your liking, click the 'Download chart' button on the upper right to export that chart exactly as-is.
- See and export the data as a table by clicking ‘Show data table’ under the chart. Some values that are presented as rates may also have raw counts available.
- Note the error value present below some of the values in the data table representing the margin of error in the estimates.
Learn more
Visit our About page to view the Indicator Index or dive deeper into our Methodology.
The Indicator Index is a list of all the indicators and map assets displayed on each page. Each indicator has a description and a link directly to its public source. Our data methodologies explain how we transform data to reflect the community boundaries.